
Most trading strategies are evaluated using a familiar set of statistics.
Metrics like Sharpe Ratio, Sortino Ratio, Profit Factor, Maximum Drawdown, and Win Rate have become standard tools for comparing systems.
These metrics are useful because they summarize important characteristics of a strategy’s behavior. They help answer questions such as:
- How consistent are the returns?
- How large are the drawdowns?
- How efficiently does the strategy convert risk into profit?
However, while these metrics are essential, they are still partial views of a system.
Two strategies can have similar Sharpe ratios while behaving very differently in practice. One may generate steady returns across multiple regimes, while another may rely on narrow windows of performance surrounded by unstable periods.
Likewise, a strategy with a strong profit factor may still operate under significant internal strain – large swings in exposure, unstable parameter sensitivity, or behavior that only works in very specific market conditions.
In other words, traditional metrics describe the outcome, but they do not always describe how the system produces that outcome.
For research environments that aim to move strategies from simulation into production, understanding that structure becomes critical.
Adding Structural Diagnostics
To better understand the internal behavior of a strategy, we evaluate systems using three additional diagnostic perspectives:
Stress %
Stress % measures how much pressure the strategy experiences while producing returns. It reflects the roughness of the path taken to generate those returns – volatility in the equity curve, instability across market conditions, and how much strain the system undergoes while operating.
Lower values generally indicate that the strategy is producing results with less internal pressure.
Performance %
Performance % represents an efficiency score. It measures how effectively the strategy converts its activity or risk exposure into usable outcomes.
A strategy with strong performance efficiency extracts more results from the same level of exposure, capital usage, or operational activity.
Higher values suggest that the system is making better use of the risk it takes.
Estimated Profit %
Estimated Profit % provides a normalized view of return potential. Instead of focusing only on raw historical profit, it expresses the strategy’s expected profitability in a cleaner, more comparable way.
Higher values indicate stronger long-term return potential.
Why All Three Matter
Looking at a single metric can easily lead to misleading conclusions.
A strategy may show high estimated profit but also operate under high stress, suggesting that the returns are achieved through unstable behavior.
Another strategy may show very low stress, appearing safe and stable, but may convert risk into results inefficiently.
A third configuration might perform efficiently while still producing limited overall profitability.
When evaluating a large number of configurations, the most interesting candidates are rarely the ones that simply maximize one metric. Instead, they tend to be the strategies that balance all three dimensions well.
Visualizing the Strategy Space
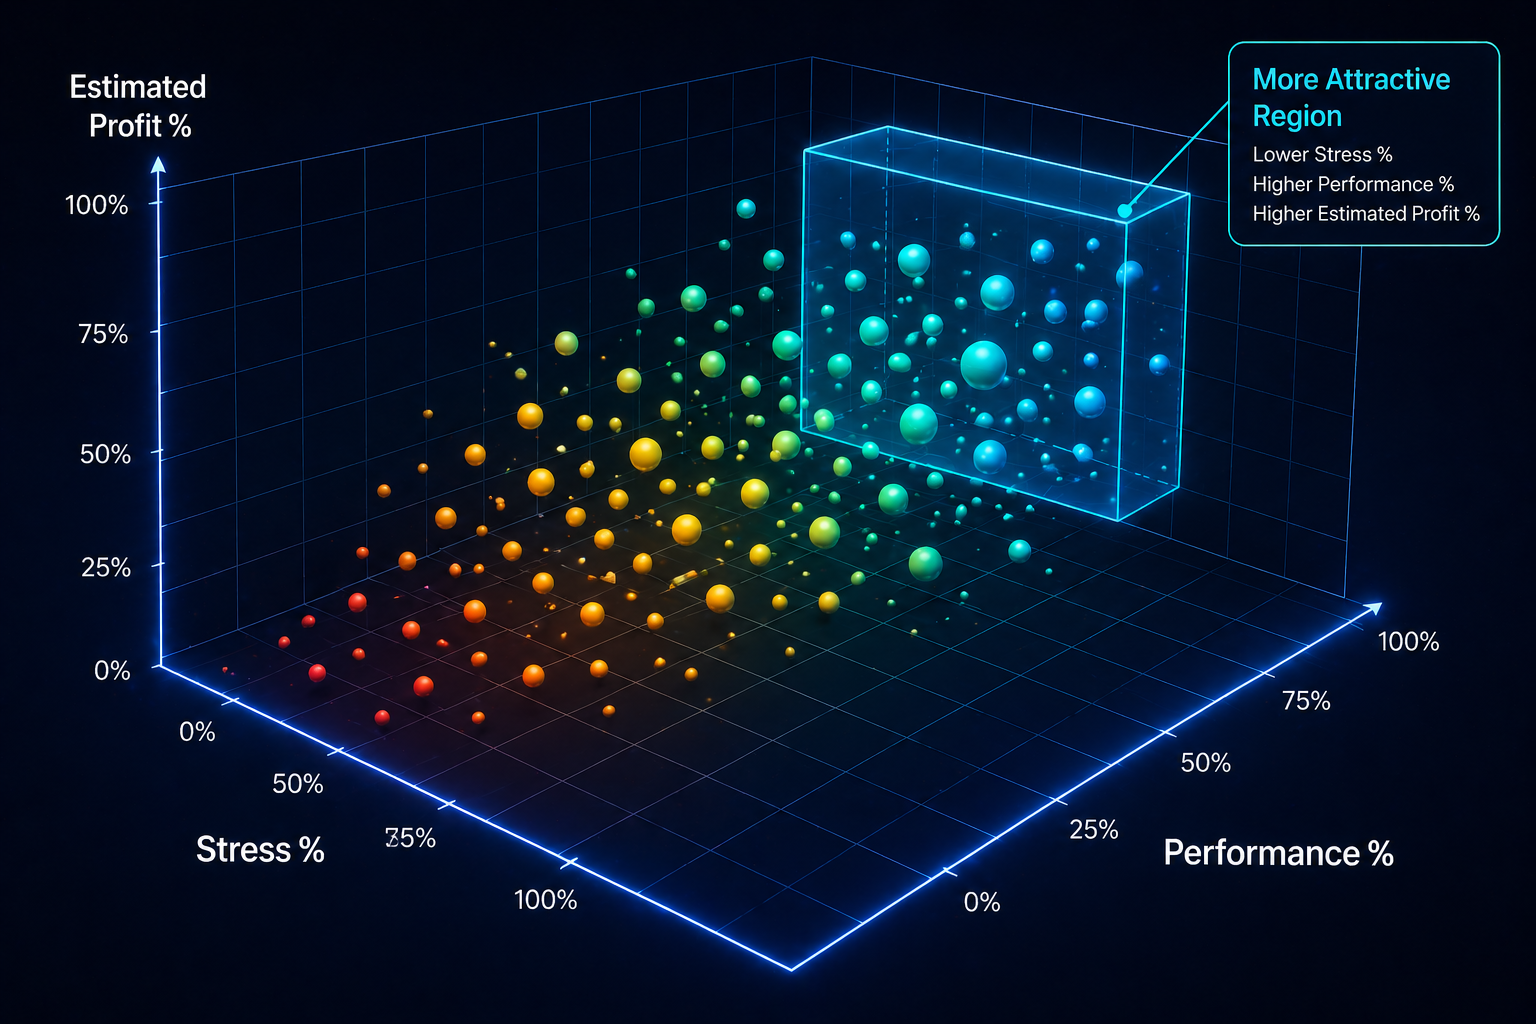
To make this comparison clearer, strategies can be plotted in three-dimensional space.
- X-axis: Stress %
- Y-axis: Performance %
- Z-axis: Estimated Profit %
Each point in the graph represents a strategy configuration, parameter set, or trading pair.
This visualization makes it easier to identify strategies that sit in the more attractive region of the space – configurations that combine:
- lower stress
- higher performance efficiency
- higher estimated profitability
Instead of focusing on a single ranking number, this view helps researchers see the broader landscape of system behavior.
Clusters begin to appear. Some strategies group around high-stress zones. Others form pockets of efficiency with moderate profitability. The most promising candidates tend to emerge where multiple desirable characteristics overlap.
Complementing Traditional Metrics
These diagnostics are not intended to replace traditional performance metrics.
Sharpe ratio, drawdown analysis, and profit factor remain essential tools for evaluating risk-adjusted returns.
However, those metrics primarily describe what the results look like.
The Stress %, Performance %, and Estimated Profit % framework attempts to describe how the strategy behaves while producing those results.
By combining both perspectives, it becomes easier to filter out strategies that look good statistically but may struggle to survive real market conditions.
From Research Insight to System Design
Ultimately, the goal of strategy evaluation is not simply to find profitable simulations.
The goal is to identify systems that can remain stable, efficient, and profitable under real market pressure.
By analyzing strategies across multiple dimensions – both traditional statistical metrics and structural diagnostics – researchers can better understand how systems behave before committing them to production environments.
Because the strategies that survive live markets are rarely the ones with the highest simulated profit.
They are the ones with the most balanced structure.